A propósito de los debates sobre el tamaño del PBI de los países más grandes del planeta, The Economist publicó una serie de notas acerca de las predicciones en el futuro más próximo, de las que se deduce que, si bien se venía previendo que la economía China podía superar a la estadounidense para 2019 (debido a que, aún estando por debajo en niveles, muestra tasas de crecimiento mucho mayores), es necesario revisar esos pronósticos ya que si sólo se utiliza un tipo de medición específica (el Purchasing-Power Parity en inglés -PPP-, la Paridad de Poder Adquisitivo en castellano) en lugar de los dólares corrientes, este evento podría ocurrir este mismo año o el próximo.
Ello se debe a cuestiones cambiarias, básicamente.
Van las dos notas más importantes, que se encuentran acá y acá:
China will become the world's largest economy by the end of the year
 UNTIL 1890 China was the world’s largest economy, before
America surpassed it. By the end of 2014 China is on track to reclaim
its crown. Comparing economic output is tricky: exchange rates get in
the way. Simply converting GDP from renminbi to dollars at market rates
may not reflect the true cost of living. Bread and beer may be cheaper
in one country than another, for example. To account for these
differences, economists make adjustments based on a comparable basket of
goods and services across the globe, so-called purchasing-power parity
(PPP). New data
released on April 30th from the International Comparison Programme, a
part of the UN, calculated the cost of living in 199 countries in 2011.
On this basis, China’s PPP exchange rate is now higher than economists
had previously estimated using data from the previous survey in 2005: a
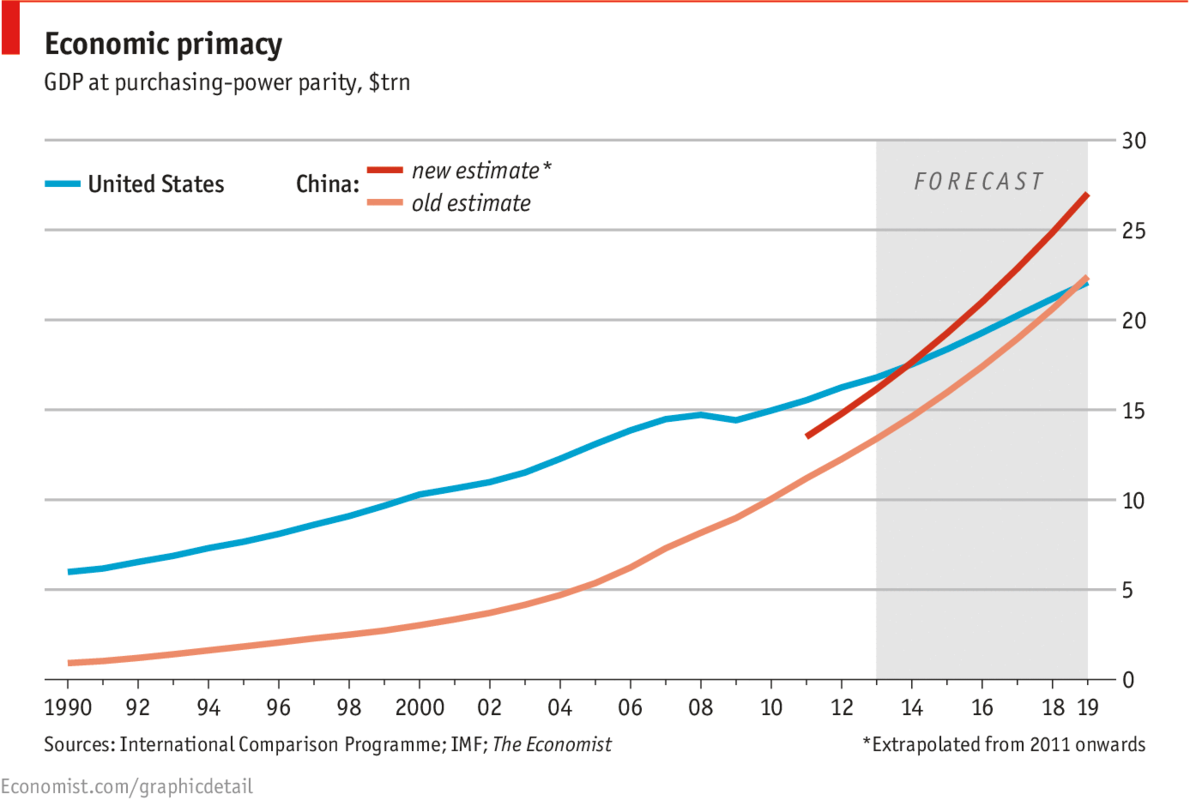
whopping 20% higher. So China, which had been forecast to overtake
America in 2019 by the IMF, will be crowned the world's pre-eminent
country by the end of this year according to The Economist’s calculations. The American Century ends, and the Pacific Century begins.
UNTIL 1890 China was the world’s largest economy, before
America surpassed it. By the end of 2014 China is on track to reclaim
its crown. Comparing economic output is tricky: exchange rates get in
the way. Simply converting GDP from renminbi to dollars at market rates
may not reflect the true cost of living. Bread and beer may be cheaper
in one country than another, for example. To account for these
differences, economists make adjustments based on a comparable basket of
goods and services across the globe, so-called purchasing-power parity
(PPP). New data
released on April 30th from the International Comparison Programme, a
part of the UN, calculated the cost of living in 199 countries in 2011.
On this basis, China’s PPP exchange rate is now higher than economists
had previously estimated using data from the previous survey in 2005: a
whopping 20% higher. So China, which had been forecast to overtake
America in 2019 by the IMF, will be crowned the world's pre-eminent
country by the end of this year according to The Economist’s calculations. The American Century ends, and the Pacific Century begins.
La otra nota:
 THERE are a number of ways to measure the might of a nation: military
power, commercial clout, cultural influence. But ever since
statisticians started rigorously calculating economic output in the
1930s, economists have fixated on one measure: gross domestic product
(GDP). By one variant of that yardstick, China is on the verge of
becoming the world’s mightiest country.
THERE are a number of ways to measure the might of a nation: military
power, commercial clout, cultural influence. But ever since
statisticians started rigorously calculating economic output in the
1930s, economists have fixated on one measure: gross domestic product
(GDP). By one variant of that yardstick, China is on the verge of
becoming the world’s mightiest country.
Comparing the economic output of countries is tricky. The most
straightforward way is to convert GDPs into a single currency (usually
dollars) at market exchange rates. This is a good way to gauge
countries’ international heft, and by this measure China’s economy is
still 43% smaller than America’s. But for comparing living standards or
growth rates, market exchange rates can be misleading. Exchange rates
can be volatile, yielding vastly different GDP values on different days.
Governments often meddle with them. Most important, they are influenced
by prices for internationally traded items, but they do not reflect the
cost of purely domestic goods and services, such as haircuts or bus
rides. Since rich-world barbers are more expensive than those in poor
economies but not vastly more productive, using market exchange rates to
compare GDPs understates the productive capacity and living standards
of the emerging world.
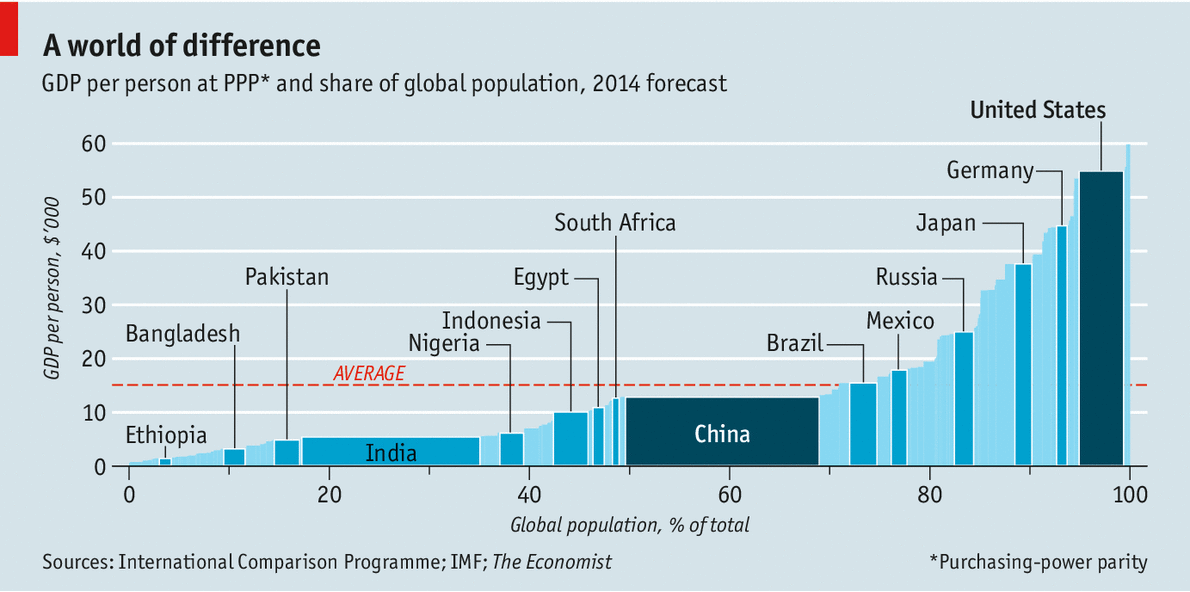
The International Comparison Programme (ICP) was established in 1968 in an attempt to allow for such things. Statisticians collate the cost of comparable goods and services in different countries. They then adjust output figures to take account of the lower cost of those items in poorer countries—a method known as purchasing-power parity (PPP). The Economist’s Big Mac index is based on the same premise, although it looks at the price of just one item. The ICP’s first survey in 1970 took in only ten countries. The latest, released on April 30th but based on prices from 2011, provides data for 199 economies and estimates for another 15 (see chart).
The previous ICP survey, released in 2005, attracted criticism for its results from China, which were based on data from just 11 cities. This, some argued, overestimated the cost of living and therefore underestimated the size of the Chinese economy on a PPP basis. That, along with the difficulty of accounting for varying rates of inflation since 2005, meant the PPP data were getting ever more inaccurate: the new data put China’s PPP exchange rate 20% higher. The old PPP exchange rates had suggested that China’s economy would overtake America’s in 2019; the new ones imply that it will do so by the end of this year.
A similar uprating has caused a shuffling of the pack elsewhere, too. Indonesia, which was thought to be the world’s 15th-biggest economy, is now ninth. Indeed the six biggest emerging economies now produce goods and services of equal value to the six biggest rich countries. Further number-crunching is required to work out the impact of the new exchange rates on the global poverty rate (which is typically defined to include all who live on less than $1.25 a day at PPP); that will take a year or more. But the ICP’s report does tentatively suggest that “the world has become more equal”, as the number of people living in countries with a GDP per person of at least half of America’s has risen slightly, from 15% in 2005 to 16% in 2011.
Ello se debe a cuestiones cambiarias, básicamente.
Van las dos notas más importantes, que se encuentran acá y acá:
Crowning the dragon
China will become the world's largest economy by the end of the year
La otra nota:
Measuring GDP
The dragon takes wing
New data suggest the Chinese economy is bigger than previously thought
Our interactive prediction tool lets you estimate when China’s GDP might eclipse America’s at market exchange-rates
The International Comparison Programme (ICP) was established in 1968 in an attempt to allow for such things. Statisticians collate the cost of comparable goods and services in different countries. They then adjust output figures to take account of the lower cost of those items in poorer countries—a method known as purchasing-power parity (PPP). The Economist’s Big Mac index is based on the same premise, although it looks at the price of just one item. The ICP’s first survey in 1970 took in only ten countries. The latest, released on April 30th but based on prices from 2011, provides data for 199 economies and estimates for another 15 (see chart).
The previous ICP survey, released in 2005, attracted criticism for its results from China, which were based on data from just 11 cities. This, some argued, overestimated the cost of living and therefore underestimated the size of the Chinese economy on a PPP basis. That, along with the difficulty of accounting for varying rates of inflation since 2005, meant the PPP data were getting ever more inaccurate: the new data put China’s PPP exchange rate 20% higher. The old PPP exchange rates had suggested that China’s economy would overtake America’s in 2019; the new ones imply that it will do so by the end of this year.
A similar uprating has caused a shuffling of the pack elsewhere, too. Indonesia, which was thought to be the world’s 15th-biggest economy, is now ninth. Indeed the six biggest emerging economies now produce goods and services of equal value to the six biggest rich countries. Further number-crunching is required to work out the impact of the new exchange rates on the global poverty rate (which is typically defined to include all who live on less than $1.25 a day at PPP); that will take a year or more. But the ICP’s report does tentatively suggest that “the world has become more equal”, as the number of people living in countries with a GDP per person of at least half of America’s has risen slightly, from 15% in 2005 to 16% in 2011.
No hay comentarios:
Publicar un comentario